Background & Theory
The Clausius–Clapeyron (CC) relationship states that the atmosphere’s capacity to hold water vapor increases exponentially with temperature, approximately
This implies that extreme precipitation intensities are expected to rise with warming due to increased moisture availability. This thermodynamic link underpins the concept of extreme precipitation–temperature scaling, where extreme precipitation (often defined as the 95th or 99th percentile of wet intervals) increases exponentially with near-surface air temperature. Consequently, temperature is considered a strong physical covariate in non-stationary extreme value models.
Traditional approaches such as binning or quantile regression can capture this scaling behavior and have been used to estimate future changes. However, they face notable limitations: they cannot reliably estimate very high return levels (e.g., 𝒯-year extremes), often assume constant storm frequency, and struggle with observed non-linearities—such as the “hook” structure, where the scaling breaks down at high temperatures due to humidity constraints or data scarcity. An another drawback of this traditional p-t scaling is that the percentile are computed based on all wet-day intervals, and thus, they are sensitive to changes in rainfall occurrence and intensity and can’t be directly translated into extreme return levels. These drawbacks highlight the need for more robust and physically-consistent models, like TENAX, that account for the full distribution and changing event frequencies.
What is TENAX?
TEmperature dependent Non Asymptotic model for eXtreme return levels
Objective: Develop a novel statistical model to project future sub-hourly (to hourly) extreme precipitation return levels, using a temperature-dependent framework.
The model integrates:
In situ precipitation and temperature observations
Climate model temperature projections on wet days (or temperatures during X preceding the peak intensities)
Projected changes in precipitation frequency (represented by change of mean, variance and average number of annual precipitation events)
It uses a parsimonious, non-stationary, non-asymptotic approach, treating temperature as a physically meaningful covariate.
Importantly, the model aims to separate the physical link between extreme precipitation and temperature from the frequency of precipitation events.
We combine:
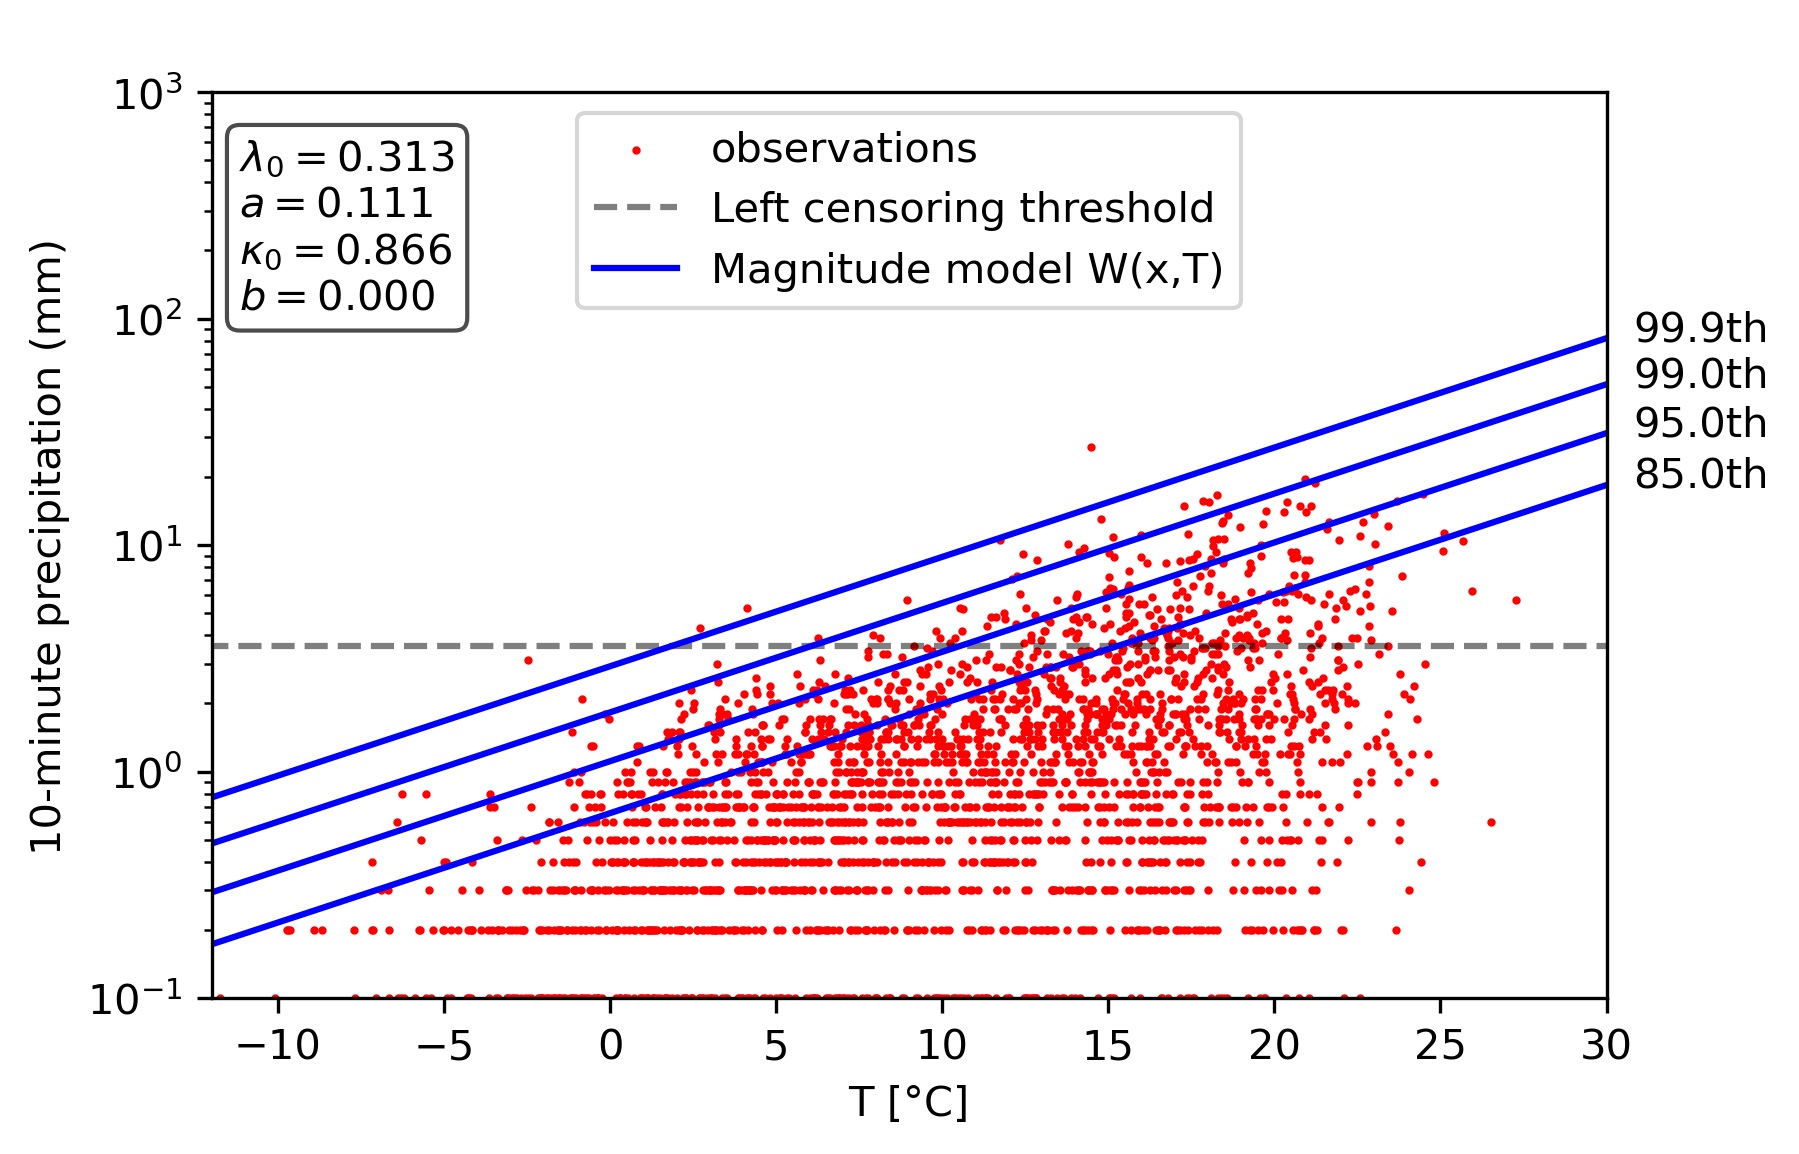
Magnitude model W(x; T): A non-stationary statistical model for the cumulative distribution function of the precipitation event magnitudes that uses temperature as a covariate.
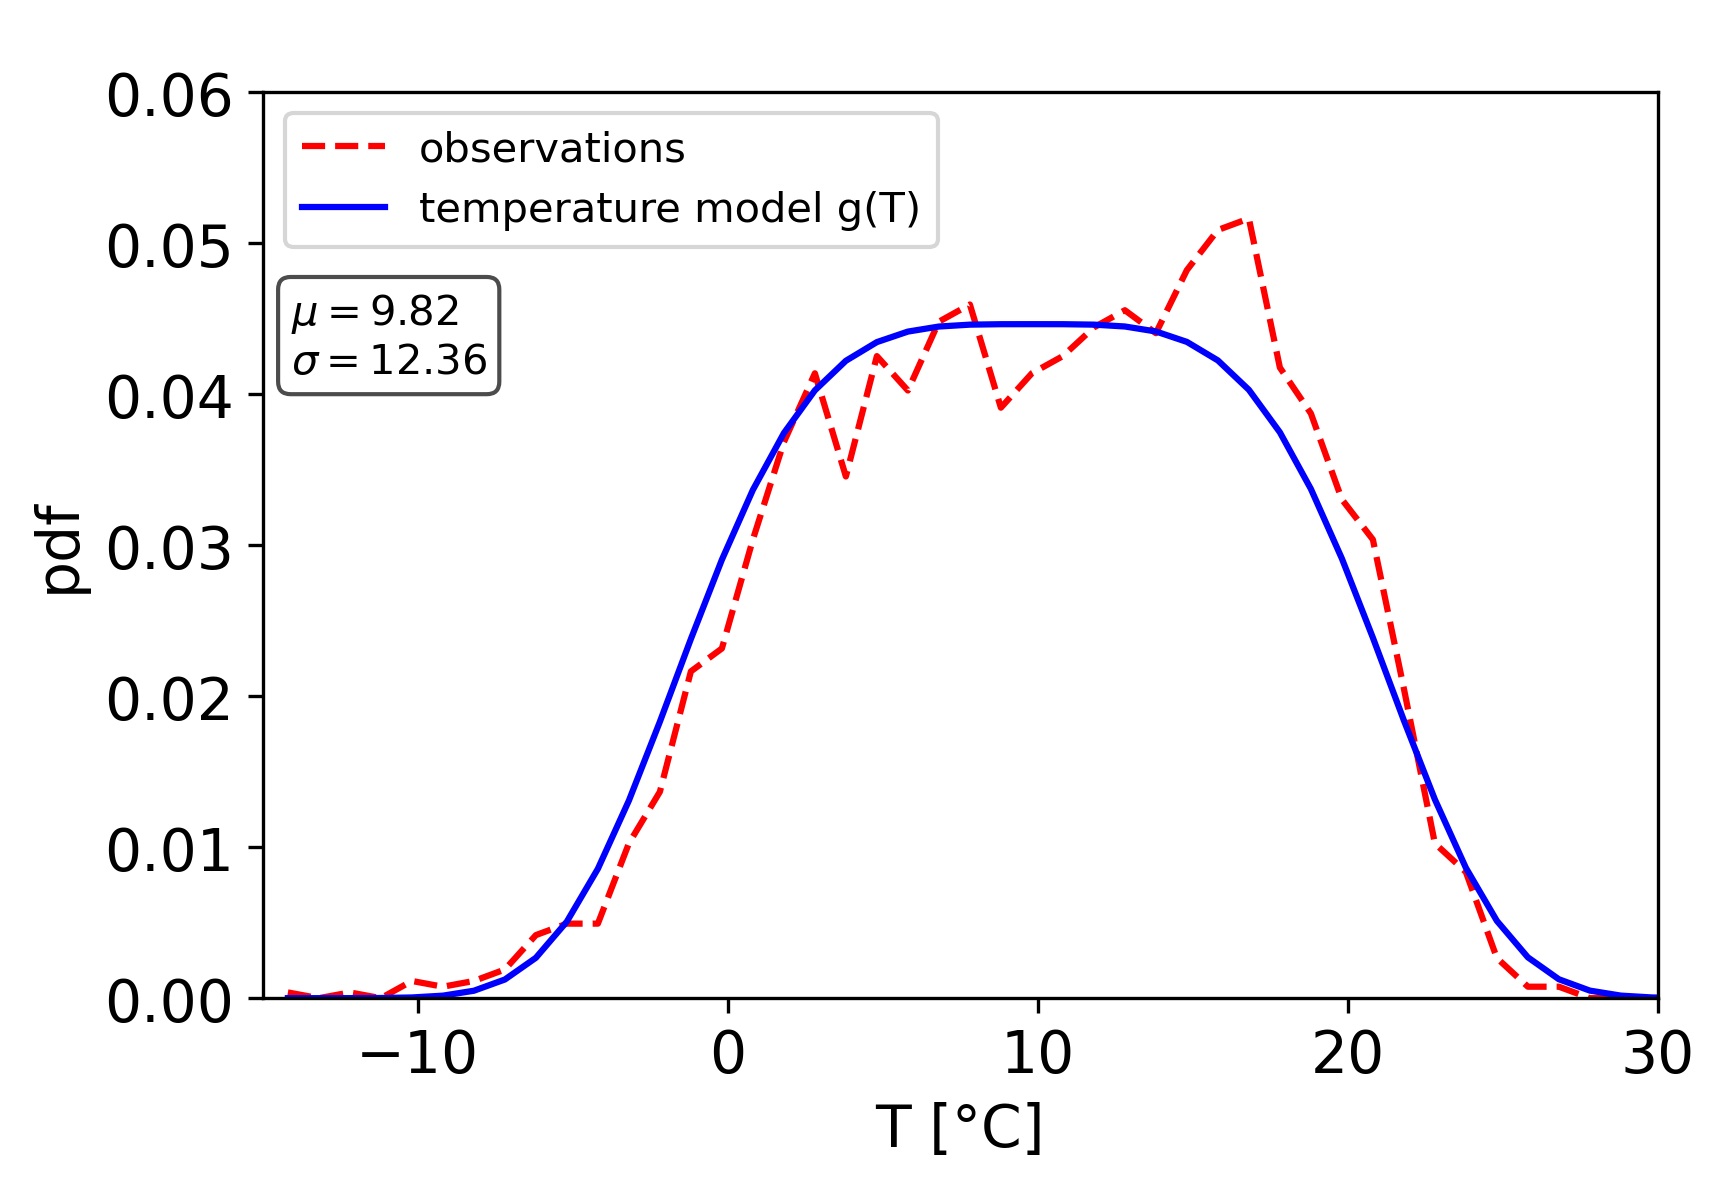
Temperature model g(T): An analytical probability density function for temperatures during precipitation events.
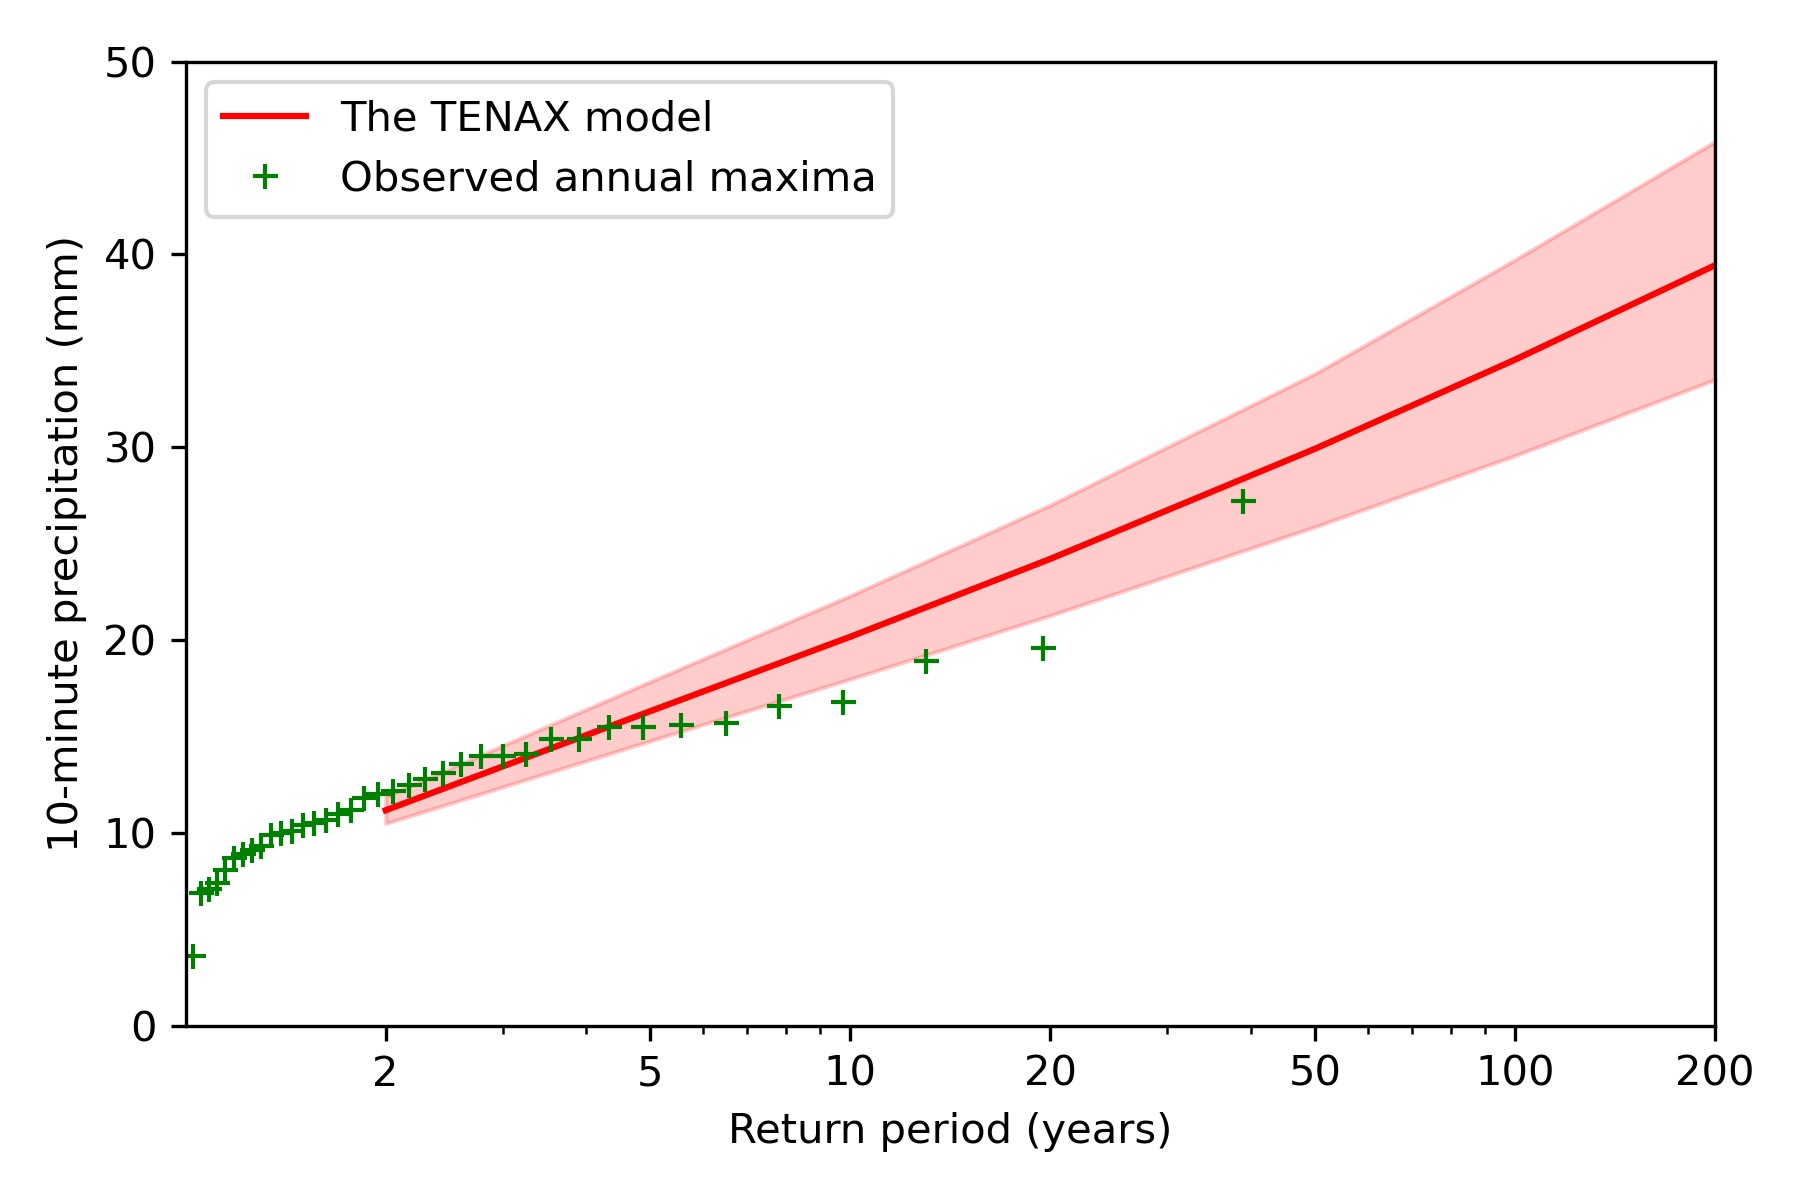
Return levels estimation: A non-asymptotic formulation for extreme return levels.
Denoting with W(x; T) the cumulative distribution function of the magnitude of the events occurring at a temperature T and with g(T) the probability density function of temperatures at which the precipitation events occur, the (marginal) parent cumulative distribution function of the event magnitudes F(x) becomes:
where D is the domain of g(T).
Magnitude model
The magnitude model has four parameters: λ₀, a, κ₀, and b.
Then, we use the Weibull distribution to model the magnitudes of sub-hourly precipitation events (ordinary events). This model, characterized by powered-exponential (Weibull-like) tails, is supported by thermodynamic arguments presented in [Wilson_and_Toumi_2005]. As their results focus on the tail of the distribution, we apply censoring to remain consistent with their framework.
The magnitude model, denoted as W(x; T), is a non-stationary statistical model that describes the exceedance probability of extreme precipitation intensities as a function of temperature (T). This formulation incorporates the underlying physical processes associated with precipitation at a given temperature.
The Weibull distribution characterizes the non-exceedance probability of event magnitudes using two parameters:
λ(T) – the scale parameter
κ(T) – the shape parameter
The mathematical form of the non-exceedance probability is given by:
This model allows the parameters to respond to changes in temperature, enabling a physically consistent representation of the intensities of extreme precipitation events.
The Clausius–Clapeyron relation implies an exponential increase in extreme precipitation with rising temperature. In the Magnitude model, this translates into an exponential dependence of the scale parameter λ(T) on temperature T, modeled as:
Additionally, because the scaling of extreme precipitation can vary across quantiles, the shape parameter κ(T) may also depend on temperature. Although this dependence is less certain and can be masked by estimation uncertainty, we adopt a linear form for simplicity:
Some research also suggests that an exponential form may be more appropriate, which we are testing currently:
Model parameters are estimated using maximum likelihood, with observations left-censored below a defined threshold \(\vartheta^*\).
Temperature Model
In our example case, the average temperatures observed during D_h hours (D_h=24h) preceding peak intensities are well described by a generalized Gaussian distribution with a shape parameter β = 4. This models works well in the Alps and Germany (where we tested), but needs to be carefully selected if one goes into another region.
The probability density function (PDF) is given by:
where μ and σ are the location and scale parameters, respectively. These parameters can be estimated using the maximum likelihood method.
Return level estimation
Once the magnitude model \(W(x; T)\) and temperature model \(g(T)\) are defined, the TENAX framework estimates the distribution of annual maximum precipitation using a Monte Carlo approach. A large number of temperature samples \(T_i\) are drawn from \(g(T)\), and the cumulative distribution function \(F(x)\) is approximated numerically.
The distribution of annual maxima is estimated using:
Return levels are obtained by inverting this equation.
Supporting literature for background
Marra, F., Borga, M., and Morin, E.: A unified framework for extreme subdaily precipitation frequency analyses based on ordinary events. Geophysical Research Letters, 47(18), e2020GL090209. https://doi.org/10.1029/2020GL090209, 2020
Wilson, P. S., and Toumi, R.: A fundamental probability distribution for heavy rainfall. Geophysical Research Letters, 32(14), 1–4. https://doi.org/10.1029/2005GL022465, 2005